|
Chart Your Progress
|
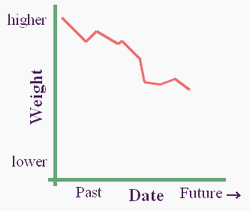
One of the simplest dieting tools I use with my clients is a weight loss graph. There's nothing better than being able to look at your progress in black and white! (Especially when your trend is going down.)
 |
Keeping a visual record of your weight requires only two things:
- A good bathroom scale
- The ability to create something that looks like this
==============>
There are two basic ways to keep a graph:
- pencil and paper
- an online weight loss graph
If you decide to go the pen and paper route, simply buy some graph paper and set up 2 axises:
- a horizontal axis with dates
- a vertical axis with your weight
How often should I plot on my weight loss graph?
This question is simply code lingo for "how often should I weigh myself?"
Several well-controlled studies have found that daily weighing helps with both weight loss and prevention of weight gain. However, if you're one of those people (like me) who goes into a tailspin if the number isn't good and has a bad day as a result, then weighing only once a week is probably a better idea.
Or, try this...
...Plot your weight on the first day of every month for an entire year. That way you'll clearly be able to see your weight trend over time, without being distracted by daily water weight fluctuations. Start a file to keep your graphs in, so you can easily access your weight history when necessary.
An important note about weighing yourself
Weigh at the same time each day, preferably in the morning. You will almost always weigh more at the end of the day after a full day of fluid and food.
Make a decision about how often you'll weigh yourself, then simply plot your daily, weekly, or monthly weight on your weight graph and connect the dots.
The result...
...A fabulous representation of your weight trend as the days, weeks, and months go by. Looking at the big picture makes it easier to see if you truly are losing, gaining, or maintaining your weight. Knowledge is power!
More of My Professional Advice You May Find Useful
More weight loss tools.
Back to Personal Nutrition Guide Home.


